Engage your audience with the power of interactive visuals

Using interactive visuals on your website can be a powerful way to build engagement and tell your story.
Your website is central to your organisation’s communication strategy, brand image and route to market. Whether you’re in government, property, financial services or mining and resources, your website is is often the first point of contact for individuals seeking information - whether they are investors, customers, prospective employees, or other key stakeholders.
Whatever else you do, your website is the one asset you need to get right to engage your audience and communicate your story.
Key Takeaways
-
You have just 15 seconds to engage a website visitor before they go somewhere else.
-
Interactive visuals can enhance user engagement by capturing attention quickly and offering a more intuitive and enjoyable experience.
-
Well-designed interactive visuals, like maps or timelines, can increase website engagement and reduce bounce rates significantly.
-
Interactive visuals are most effective when communicating complex information or enabling users to refine data based on their needs.
And yet, as analyst firm Forrester reported recently, many companies “settle for a user experience that meets the bare minimum — task completion — without paying enough attention to making the process intuitive and enjoyable for the user.” 1
The result can be seen in web usage statistics:
-
Average bounce rate is 49% and rising 2
-
The average time spent on a web page is just 54 seconds 3
-
Worse, the first 15 seconds are critical to users’ stay or leave decision 4.
If your goal is communication and building engagement with site visitors, then you need to quickly catch and hold their attention with content that obviously meets their needs.
One effective solution for this is the use of interactive visual elements.
The role of interactive elements in website success
Interactive visuals work at several levels. As equ’s Senior UX Designer Graeme Heath says, they “add life and a dynamic quality that we find satisfying and visually pleasing.”
Pictures can be more powerful than words. The right image (discoverable, clear, conceptually familiar but unique) can be more memorable and more effective at communicating information – the picture-superiority effect. 5
“We are visual beings: we take the world in mainly through visual receptors,” says neuroscientist Carmen Simon. “Pictures are often more enjoyable and help us arrive at meaning more quickly. They also tend to provoke stronger emotions and provide a context.” 6
Being interactive adds a further dimension. Enabling a user to interact with and control the information they’re working with builds engagement and immersion.
Paul Zak’s work on immersion has shown that if an experience doesn’t capture attention in the first 15 seconds, it is unlikely to do so at all. 7 As renowned web usability consultant Jakob Nielsen noted, visitors to a web page form a decision on whether to stay or not within the first 10-20 seconds.
Zak’s research suggests that, after those vital 15 seconds, you need to provoke an emotional response in order to fully engage the reader/viewer. A well-designed interactive visual can achieve that while also efficiently communicating information. But design is key.
Creating an interactive visual
As Graeme explains, “Clients often have complex information that would be best rendered in a visual way – perhaps a timeline or a map.”
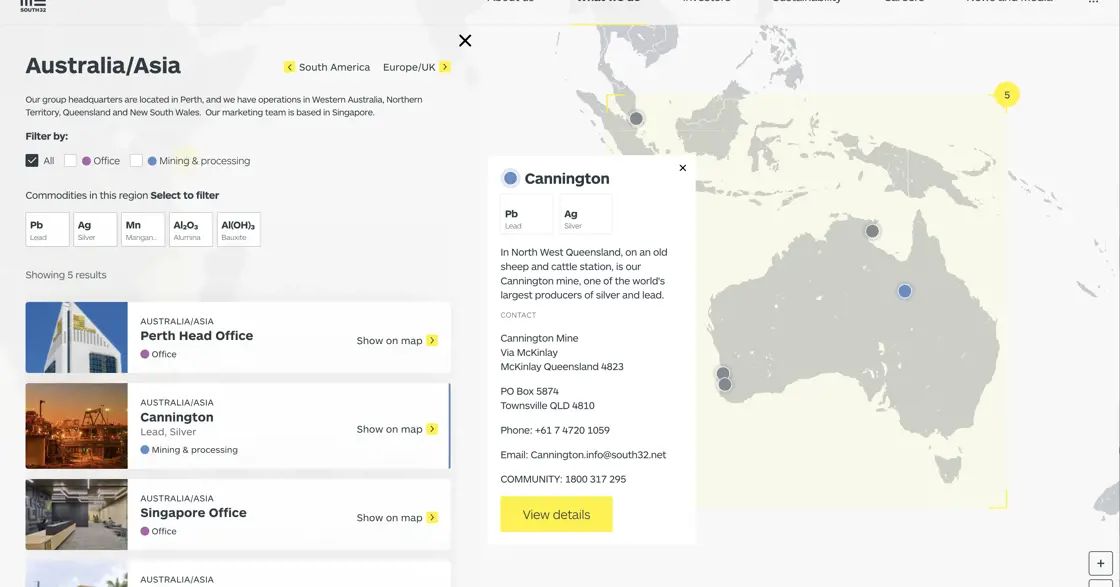
“Whatever we do,” he continues, “we need to ensure that the information being presented is useful to the audience and that it is in a format that will encourage engagement. The map we developed for South32 is a perfect example. Rottnest Island is another.”
For South32, a global mining and metals company, the information was location-based and included the activity going on at each location, the mineral being mined and information about each mining operation.
The equ team designed an interactive map that encouraged the user to click and drill down into each location. They could also filter by location, type of site or mineral being produced.
In designing interactive elements the balance of functionality versus creativity is critical. As Graeme says, “Ultimately, this is about user experience. We want to create the format that will best encourage engagement. With South32, for example, we could have presented the data in a simple, filterable list, but only a serious researcher would find that engaging. We would lose the opportunity to communicate the complexity of South32’s operations to a wider audience. The map is more instantly engaging.”
The map enables the viewer to instantly grasp the breadth of South32’s operations while also intuitively drilling into the area that interests them most.
How effective are interactive elements?
By leveraging the psychology that underpins the best UX, interactive, visual elements can be a powerful tool for audience engagement and communication.
South32 saw an 83% increase in engagement and a 35% decrease in bounce rates with an overall 40% increase in site visitors.
Our award-winning work for Rottnest Island saw a 94% increase in overall website sessions and a 23% increase in average session duration. Again, the bounce rate decreased by 35%.
Best practices for implementing interactive elements
Cool interactive visuals are not the answer to every website challenge, however, they work best where there is:
-
Complex information to communicate
-
A need for high visibility
-
A need to enable users to refine the information for their own purposes.
Before you start with any website enhancement, it’s important to ensure the basics of the host site are sound and functional. This involves good navigation, well written content, and well executed core visuals and media.
Once you know you are building on solid foundations, you can design the best way to convey your information.
Drawing on our team’s experience, we suggest the following approach:
-
Discover and discuss – Take time to understand the information that will drive the new enhancement. Consider also the audience and the interests of internal stakeholders. This usually requires several iterations to produce a simplified starting view of what is required.
-
Iterate and refine – Iteratively refine the design and required interactions to produce the ready-to-share version.
-
Usability over creativity – Never let a cool idea override basic usability.
-
Test, test test – Obvious … but easily forgotten. This aligns the experience with users expectations, and prevents a poor experience.
-
Ensure ongoing maintenance – Publishing your interactive visual is not the end. It is essential that the underlying data is kept up to date so that users can find accurate answers from their interactions. The design too needs to be kept current so that it keeps pace with users’ expectations from other online experiences.
Want to explore what’s possible with interactive visual elements? Are you looking to drive engagement and enhance communications? We are experts in building digital experiences with a successful track record of delivering innovative solutions for some of Australia’s largest organisations.
Get in touch with us today to explore how we can work together
---------------------------------------------------------------------------------------------
- Forrester (2024), Enhance User Confidence In Digital Experiences To Build Trust
- Contentsquare (2023), Digital Experience Benchmark Report
- HubSpot (2024), 16 Website Metrics to Track for Growth in 2024 and Beyond
- Jakob Nielsen, NN/g (2011), How Long Do Users Stay on Web Pages?
- NN/g (2024), The Picture-Superiority Effect: Harness the Power of Visuals. The effect was first described by psychologist Allan Paivio in 1971
- Carmen Simon (2016), Impossible to Ignore: Creating Memorable Content to Influence Decisions (McGraw Hill Education, New York)
- Paul J. Zak (2022), Immersion: The Science of the Extraordinary and the Source of Happiness (Lioncrest Publishing). See also https://www.getimmersion.com/vm/1/the-science-of-value-measurement
You may also like


Subscribe for insights straight to your inbox
You're all set
Keep an eye on your inbox for updates on equ insights.